New analysis reveals how much austerity has cost each person in the UK
'Fixing’ the public sector finances has suppressed Britain's economy, according to official figures.
The latest figures on public sector finance shows we’re on course for the smallest government deficit – the difference between public spending and revenue – since 2001. What they don’t show is the economic damage it has caused to get here.
Most years, in the second half of most Februaries, the associated media coverage spends numerous column inches speculating over whether the January surplus – driven by the backlog of self-employed tax receipts – was large enough for the Chancellor to meet his year-end deficit targets by March.
But for nine years, the elephant in the room has largely been missed: the sheer scale of economic damage that these targets have contributed to in the first place.
Part of the reason for this is that it is extremely hard to estimate what the economic impacts of austerity have been, and near impossible to do so using data and methodologies accepted by government themselves.
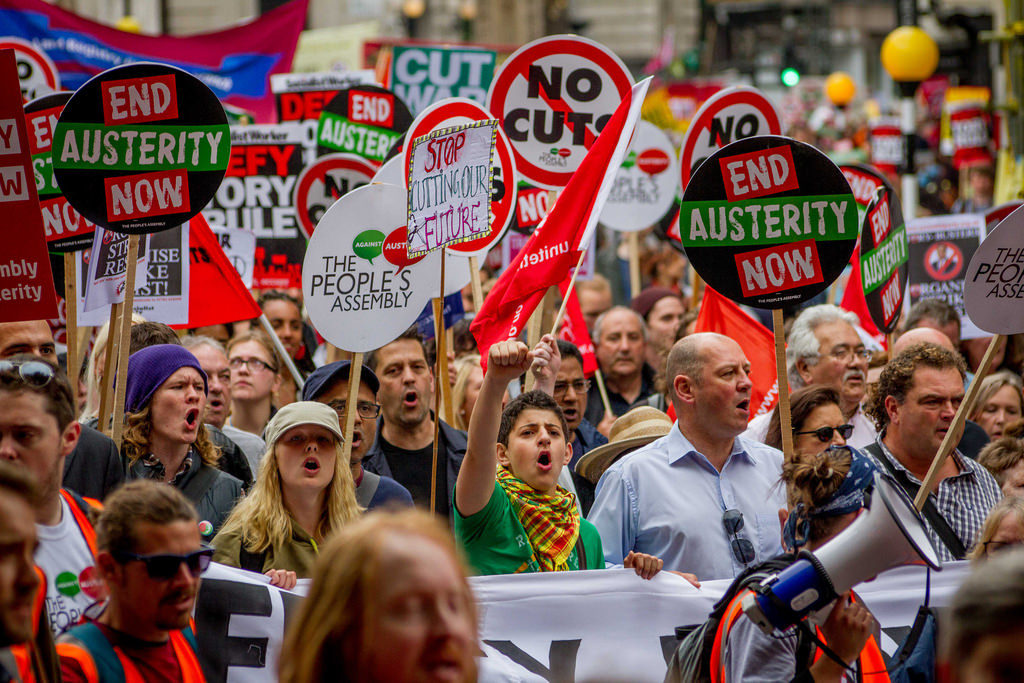
The human impacts have always been clear. Whether rising homelessness, frozen benefit payments, overcrowded school classes or excessively long waits in hospital A&E services, the starved ambition and resources of our public realm have touched the lives of almost everyone.
But what have been the impacts, if any, on the country’s overall level of income? Now, thanks to a relatively recent innovation from the Office for Budget Responsibility (OBR), it is possible to get closer to the answer than ever before. Better still, the analysis is rubber stamped by the government’s own independent watch-dog themselves.
Since 2017, the OBR have published the isolated effects of so called ‘discretionary fiscal policy’ – active government decisions over tax and spending – on GDP growth. This work differs from past estimates, where the direct effect of government decisions were previously not disentangled from assumptions over other economy-wide effects.
The most recent OBR modelling was published in December last year. Following a similar approach to that previously adopted by others, new NEF analysis has built on the latest figures to estimate the effects of austerity on GDP over the decade so far.
The calculations make for grim reading. The isolated impact of government policy has reduced GDP growth every single year since 2010.
After compounding this effect year-on-year, the effects of austerity are expected to have suppressed the level of GDP by almost £100 billion in the 2018/19 alone.
To break this number down another way, it means that deliberate policy from government over the past nine years has had the standalone effect of suppressing incomes and expenditure in the economy by just under £1,500 per person and more than £3,600 per household, in this year alone.
We also know the effects have not been evenly felt, with the heaviest burden borne by the poorest households in society.
Government will point to standard assumptions in economic models that the effects of fiscal policy erode over time. But by far the single most important reason for this is that monetary policy is supposed to offset unwanted fiscal impacts by changing interest rates.
But in actual fact, it is unlikely that this has happened to any great extent. As early as 2009, interest rates reached a point beyond which further reductions had little or no positive effect on spending in the economy – what economists now refer to as the ‘effective lower bound’. And since then, any positive effects of so called ‘quantitative easing’ have been uncertain at best.
The upshot is that many economist agree monetary policy has been unable to offset most, let alone all, of the damage from austerity to date.
It may be that the Chancellor meets his deficit reduction targets this year. We will have to wait and see. But ironically, the damage caused in doing so – in terms of weaker GDP and therefore government tax receipts over the past nine years – is also the reason that the majority of targets have also been missed since 2010.
Either way, the bigger picture is that the livelihoods of people and communities have been made bleaker as a direct consequence of the actions from their own government. Next time must be different.
Alfie Stirling is Head of Economics at the New Economics Foundation.
Pic: Flickr.
Left Foot Forward doesn't have the backing of big business or billionaires. We rely on the kind and generous support of ordinary people like you.
You can support hard-hitting journalism that holds the right to account, provides a forum for debate among progressives, and covers the stories the rest of the media ignore. Donate today.
Donate today