The damning chart which shows how UK healthcare spending lags behind comparable European countries
The Tories have failed the NHS

With Prime Minister Rishi Sunak failing to fulfil his promise to reduce NHS waiting lists, and with millions dissatisfied with the health service, it should come as no surprise that the NHS is struggling, after more than a decade of austerity and spending cuts.
It was revealed yesterday that although waiting lists fell for a fifth month in England, the number of patients waiting for treatment still remains higher than when Prime Minister Rishi Sunak promised to reduce it.
Sunak made cutting NHS waiting lists one of his five key pledges to voters when he came to power, and declared that he fully expected voters ‘to hold my government and I to account on delivering those goals.’ Instead, he has failed miserably on cutting NHS waiting lists.
Official figures show that there were 7.54 million outstanding NHS treatments in February. That compares to 7.21 million in January last year, when the prime minister made his pledge.
Cat Hobbs, director of We Own It, which campaigns against privatisation of public services and for public ownership, perfectly summed up why the NHS is struggling, posting on X: “It’s not a mystery why NHS waiting lists are so high.
“The NHS gets £40 billion LESS per year than comparable European countries.”
The below chart from the Health Foundation shows how UK healthcare spending has lagged behind European countries.
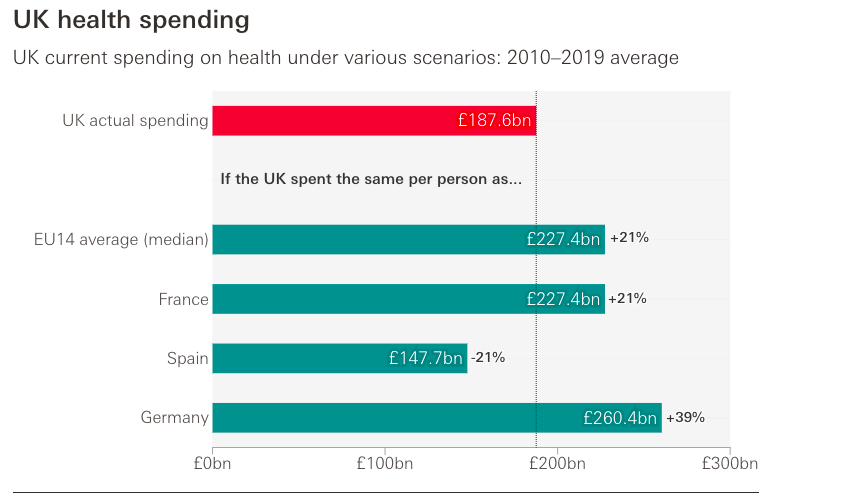
The Health Foundation also revealed that average day-to-day health spending in the UK between 2010 and 2019 was £3,005 per person – 18% below the EU14 average of £3,655.
Had UK spending per person matched the EU14 average, then the UK would have spent an average of £227bn a year on health between 2010 and 2019 – £40bn higher than actual average annual spending during this period (£187bn).
Basit Mahmood is editor of Left Foot Forward
Left Foot Forward doesn't have the backing of big business or billionaires. We rely on the kind and generous support of ordinary people like you.
You can support hard-hitting journalism that holds the right to account, provides a forum for debate among progressives, and covers the stories the rest of the media ignore. Donate today.
Donate today