Chart sums up perfectly just how bad Britain’s economy is under the Tories
It comes as a leading economic think tank warned that the UK is on course to experience five years of "lost" economic growth and is at risk of a recession next year.
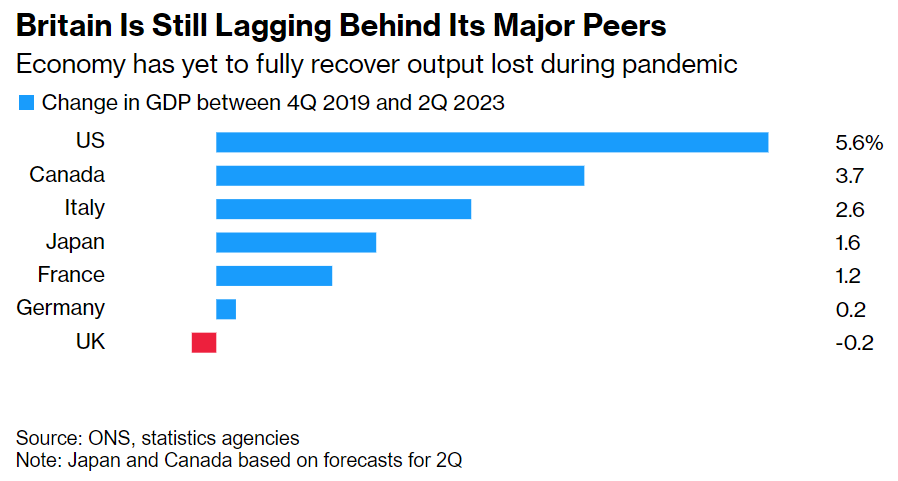
A chart has summed up perfectly just how bad Britain’s economy is in comparison to its major peers after years of Tory mismanagement.
Based on ONS data, the chart was produced by Bloomberg to show just how poor the UK’s economic output has been.
Bloomberg reports that the ‘UK remains the only Group of Seven country that has yet to fully recover from the pandemic, with output last quarter 0.2% below its level at the end of 2019.’
Add to this the fact that the UK also has a stubbornly high inflation rate in comparison to other European countries and you realise just how badly the Tory record on the economy has been. While the UK inflation rate fell to 7.9% in the year to June, down from 8.7% in May, the annual inflation rate for countries which use the euro was estimated to be 5.5% in the 12 months to June, down from 6.1% in May.
It comes as a leading economic think tank warned that the UK is on course to experience five years of “lost” economic growth and is at risk of a recession next year.
The National Institute of Economic and Social Research (Niesr) has warned that by 2024 income inequality will have grown, along with unemployment and levels of debt.
After 13 years in power, what exactly do the Tories have to show when it comes to the country’s economic performance?
Basit Mahmood is editor of Left Foot Forward
Left Foot Forward doesn't have the backing of big business or billionaires. We rely on the kind and generous support of ordinary people like you.
You can support hard-hitting journalism that holds the right to account, provides a forum for debate among progressives, and covers the stories the rest of the media ignore. Donate today.
Donate today